- Strong support at current levels with a historical pattern of gains in October, averaging 22.9% over the last 9 years.
- Bitcoin is trading in a horizontal trend channel with key support at $57,400 and resistance at $68,758.
- Significant decline in Bitcoin and Ethereum whale transactions from March to August 2024, suggesting reduced volatility.
Bitcoin (BTC) is currently demonstrating robust support at its current levels, positioning itself for potential upward movement. Historically, September tends to be a bearish month not only for cryptocurrencies but across various asset classes. However, October has shown a significantly stronger bullish trend, with BTC recording an average gain of 22.9% in 8 out of the last 9 Octobers.
Crucial Bitcoin Support and Resistance
From a technical perspective, Bitcoin appears to be navigating within a horizontal trend channel over the medium to long term. This pattern suggests investor uncertainty as they await clearer directional signals. BTC is currently trading within a rectangular formation, with support at approximately $52,772 and resistance at around $68,758. A decisive breakthrough in either of these levels could signal a new trend direction.
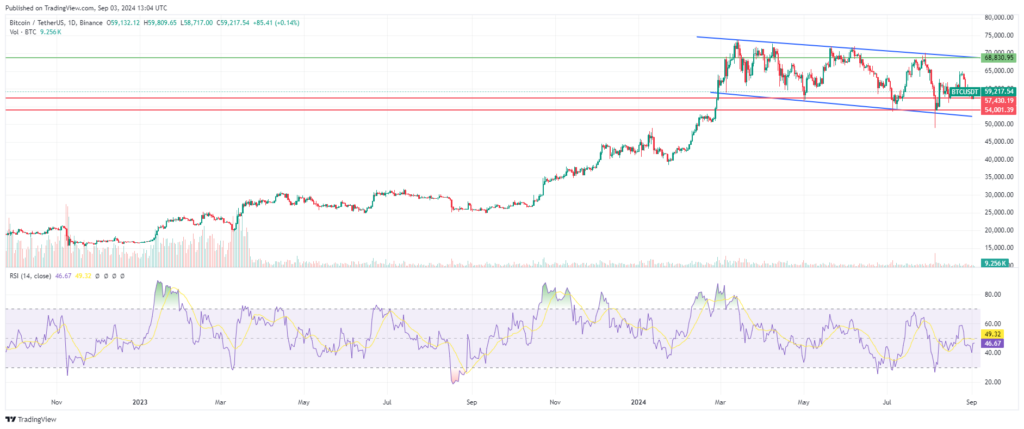
At present, Bitcoin is testing support around the $57,400 mark. A positive reaction at this level could potentially lead to upward momentum. Conversely, a downward breach of this support could signal further declines, possibly seeing BTC dip towards the $54,000 level. Volume patterns have previously shown low activity at price peaks and high activity at troughs, indicating potential weakness and an increased risk of a downward breakout.
The Relative Strength Index (RSI) curve is currently showing an upward trend, which may signal an impending reversal in the price trend. Overall, Bitcoin’s technical outlook remains neutral over the medium to long term.
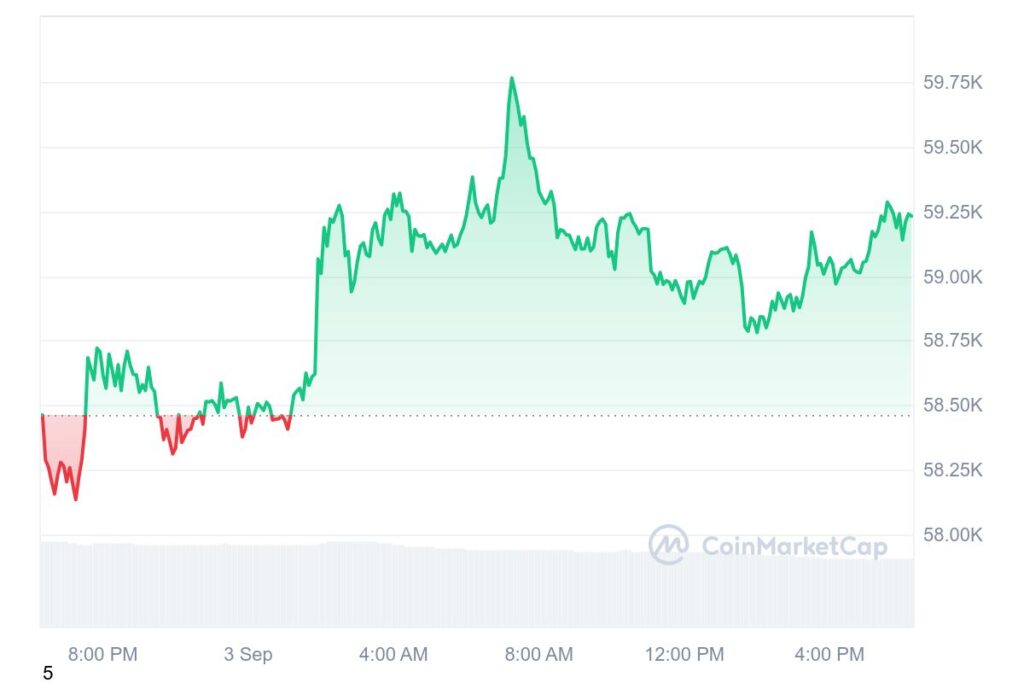
As of today, Bitcoin is priced at $59,236, with a 24-hour trading volume of $99.53 billion and a market capitalization of $1.17 trillion. The cryptocurrency holds a market dominance of 55.99%. Notably, Bitcoin’s price has increased by 1.63% in the last 24 hours.
Bitcoin Whale Activity Decline
Moreover, the data from Santiment highlights a notable reduction in whale activity for Bitcoin and Ethereum from March to August 2024. For Bitcoin, the number of whale transactions decreased from 115.1K in mid-March to 60.2K in late August. Ethereum saw a similar trend, with whale transactions dropping from 115.1K to 31.8K over the same period.

However, as you’ve pointed out, a decline in whale transactions doesn’t necessarily signal a bearish outlook. Whales often become more active during periods of high volatility, and the reduced transaction volume might simply reflect a period of relative stability rather than a precursor to a price drop.
The key takeaway from the Santiment data is that, despite the drop in transaction volume, there is still evidence of accumulation among top addresses. This suggests that while there may be fewer large transactions, those whales who are active continue to accumulate, which could be a positive sign for long-term market sentiment.
Related | Cardano’s Historic Moment: Decentralization Milestone Reached