- XRP gained nearly 9% last week, driven by the launch of the XRP Grayscale Trust.
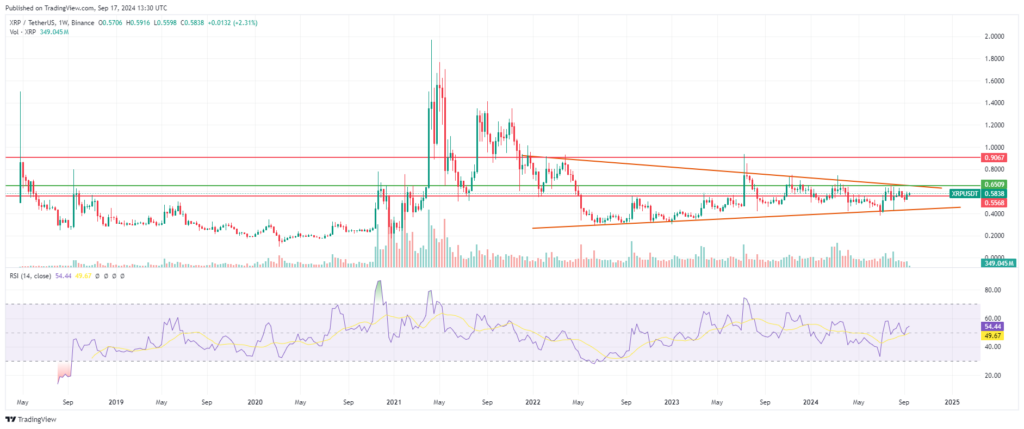
- A symmetrical triangle pattern on XRP’s chart signals a potential breakout, with resistance at $0.65.
- The RSI is nearing a crossover with the 14-day SMA, potentially triggering a bullish rally.
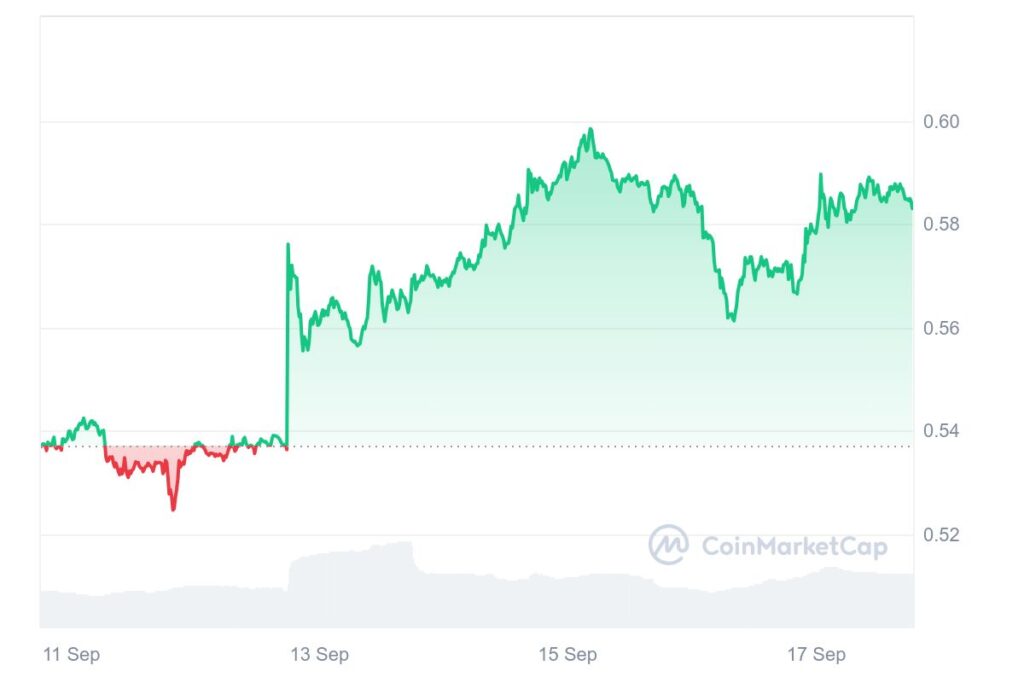
Ripple (XRP) closed the week with slight bullish momentum, but a more robust daily candle is still needed to confirm a rally toward the $0.65 resistance level and beyond. Over the past week, the token has gained nearly 9%, signaling growing upward momentum supported by several positive factors.
Among the key catalysts driving XRP’s recent price action is the launch of the XRP Grayscale Trust, which has further bolstered investor confidence. Ripple’s major legal victory against the U.S. Securities and Exchange Commission (SEC) has significantly contributed to its upward trend. The favorable outcome in the SEC case has removed much of the regulatory uncertainty surrounding XRP, clearing the way for potential institutional interest and wider adoption.
As of today, the token is trading at $0.585677, with a 24-hour trading volume of $1.95 billion. The market cap currently stands at $33.02 billion, giving it a market dominance of 1.60%. In the past 24 hours, its price has increased by 2.00%, continuing its steady climb.
Symmetrical Triangle Signals Possible XRP Breakout
XRP has caught the attention as a symmetrical triangle pattern has emerged on its charts. This formation, often signaling potential price volatility, suggests that the token may be on the verge of a significant breakout.
If the token manages to break out from this symmetrical triangle on the upside, it could trigger a long-term bullish rally, sparking renewed interest and potentially leading to substantial gains. The currency currently finds strong support at the $0.55 mark, while resistance looms around $0.65. A successful breakout past this resistance zone could set the stage for a surge toward higher levels.

Additionally, a key technical indicator, the Relative Strength Index (RSI), is approaching a crucial moment. The RSI is nearing a crossover with the 14-day Simple Moving Average (SMA), marked by the yellow line. This crossover could propel the token toward the 50 RSI region, a critical zone that may provide the thrust needed for the token to climb to new highs.
Related | Fantom (FTM) Breakout Watch: 97% Upside Potential from Broadening Wedge Pattern


